1 What to expect from the CITYCoP portal and back-end
The aim of this section is to answer some key initial questions that potential and current users of the CITYCoP system and back-end may have regarding its functionalities, role, and overall use. This is why the section has been divided in several questions, each addressing one important issue that users should consider before actually using the system.
1.1 Where is the system hosted
The decision whether to host your CITYCoP system on your own servers or use external servers and the cloud is an important one. There are pros and cons for each method, from security to control and ease of use. Assessing your own needs and reviewing the options is the first step.
If the user would like to host the system on their own servers, then they would require at least one Linux server (e.g. UBUNTU). The resources required by the system vary greatly depending on the type of adaptation and integration that users require from the CITYCoP system. The minimum server requirements for 40 Concurrent Reporting Users and 200 concurrent Viewers:
- CPU: Quad 2GHz+ CPU
- RAM: 8GB+
- Minimum hard drive space: 1TB
The current cost for a standalone system of this type was 700-1200 Euro, in May 2016. Larger cities would need to increase the power in relation to the number of users.
1.2 Who should be part of the team preparing the adoption of the CITYCoP system?
When adopting the CITYCoP system the users would need to set-up a team composed of at least one representative from their IT department and several representatives from their operational teams (e.g. police officers, 112 operators, first-line managers etc.) who would work together with the software developers to decide on the functional requirements of the system and the way it will be integrated into existing work flows. A more representative implementation team on the user side will facilitate the installation process and ensure the efficient use of the system once it is deployed. The need for a representative implementation team stems from the product’s flexibility. The CITYCoP system and back-end, in its current form, enables users to adapt it to their own needs and operational requirements (e.g. activating or deactivating certain functions, integrating it with their existing ICT systems and databases, creating new categories of reporting, etc.), which is something each user needs to consider before deployment.
1.3 How long does the implementation process last?
The duration of the implementation process depends greatly on the level of adaptation that the users require from the system. If users decide to use the product as it is or with minimum adaptation (e.g. introduction of local language, de-activation of some of the existing functionalities, selection from pre-existing reporting categories), then the installation process can take up to ~ 3 months from the first meeting to having the system rolled-out, including a one month period of internal testing. If the users require extensive adaptation (e.g. integration with current systems), then the process can extend to ~ 6 months.
1.4 What are the stages of the implementation process?
The implementation process of the CITYCoP system and back-end includes 6 main stages:
- Presentation of the product;
- Consultation between software developer and users on the type and level of adaption required;
- Work on adaptation which concludes with the production of a first version of the system;
- Pilot testing the system (3-4 weeks) in a controlled environment;
- Production of final system;
- Deployment
2 Installation Guide for the CITYCoP Portal and Back-end
2.1 General Description of the CITYCoP System
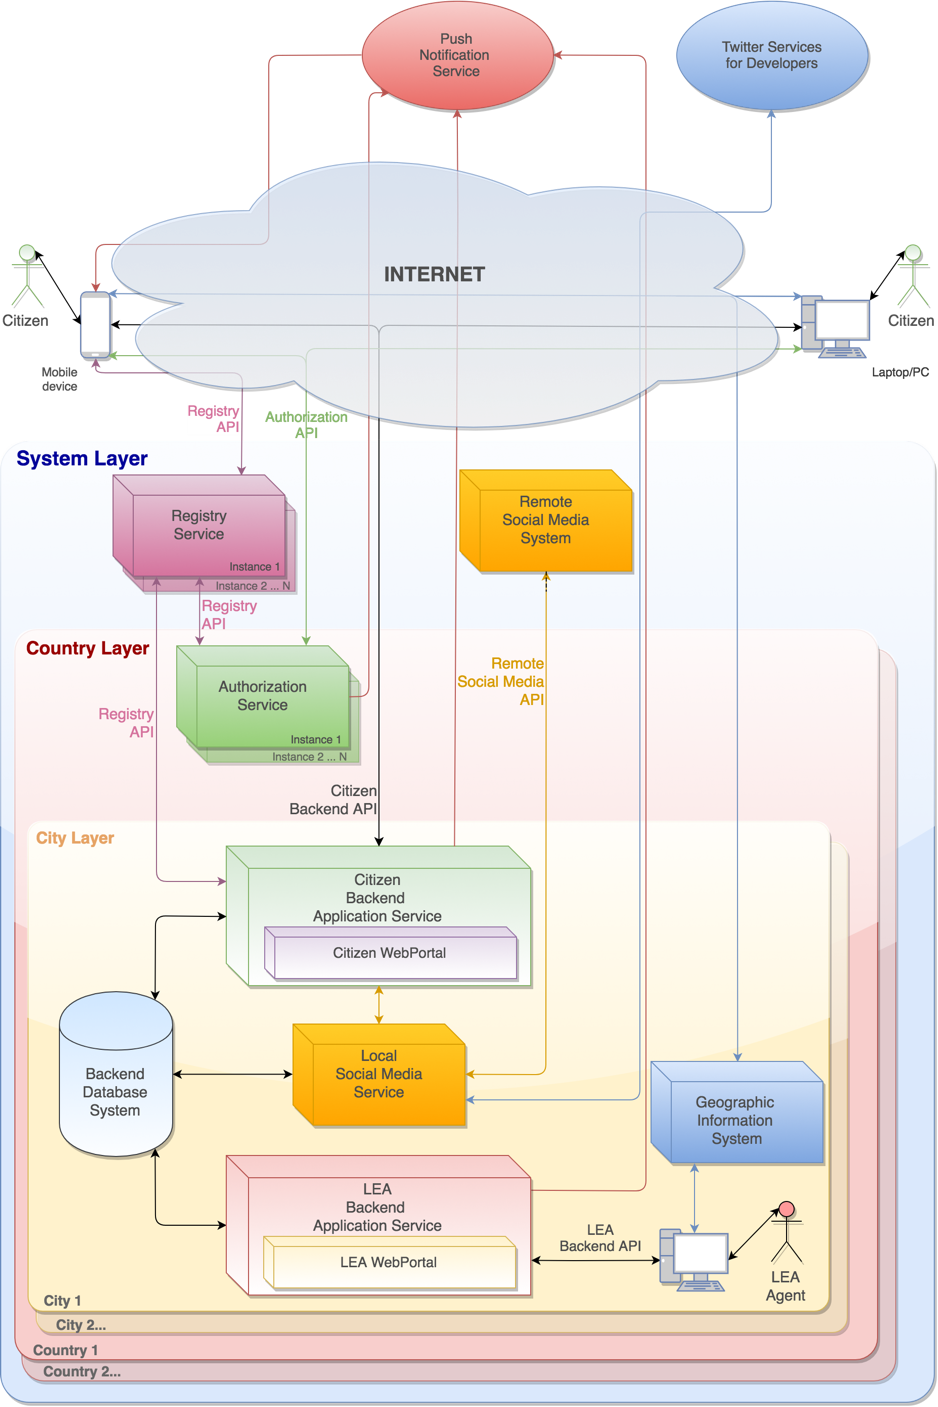
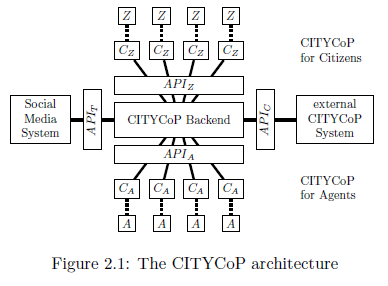
The CITYCoP system is comprised of four components: a portal, a central back-end system, a mobile app, and a social media infrastructure. The following figure (Fig. 2.1) depicts the overall architecture:
As it has been mentioned, the CITYCoP platform has a distributed architecture that contains multiple services and systems arranged on three different layers, namely the city layer, the country layer and the registry layer, in order to ensure both the security of users’ personal data and the ability to connect and use the system in any city that provides this service.
This architecture provides flexibility, reliability, and scalability to the system. It offers the possibility to extend the solution into a virtually unlimited number of countries and cities as each instance of the system runs independently of the others. The condition of independence is given by the fact that, although all instances are integrated within the system, regardless of the circumstances, an instance will not disturb the activity of other installations of the system.
2.2 Hardware Requirements for Back-end System
The primary factor that determines the requirements of the hardware for the backend system is the database access and responsiveness. The system is likely to be responding to a similar leave of peak load as the Web Portal backend. Given a max load of 200 concurrent users per 1 000 000 citizens in a city, the requirements would be the same as the Web Portal:
Minimum server requirements for 40 Concurrent Reporting Users and 200 concurrent Viewers:
- CPU: Quad 2GHz+ CPU
- RAM: 8GB+
- Minimum hard drive space: 1TB
Larger cities would need to increase the power in relation to the number of users.
2.2.1 APPLICATION SERVER
The application server will host the Node.js server and will provide the RESTful Web Services that will be used by the other components of the system to store and receive data from the Backend.
2.2.2 DATABASE SERVER
This server will host the database for the Backend system and the database for the Maps server, but if the number of concurrent user increases in time the databases can be hosted on different machines.
Hardware specifications:
- Processor: 32 cores 2.0+ Ghz
- Memory: 64GB
- Storage: 1TB
- Maps Server
Hardware specifications:
- Processor: 8 cores 2.0+ Ghz
- Memory: 16GB
- Storage: 2TB
2.3 Hardware Requirements for Web Portal
The hardware requirements for the CITYCoP servers depend on the expected utilisation of the services. For the web portal this is determined by the expected maximum number of concurrent users and the amount of data those users are transferring, both to and from their server.
Different regional coverage and number of citizens within each region mean that the hardware requirements need to scale with the number of citizens likely to use the service. According to our estimates, there would be approximately 10-20 maximum concurrent users per 100 000 citizens (20 cu/100k). Thus, we can expect peak usage for a city of 1 million people to be 200 users with 40 reports being submitted.
Minimum server requirements for 40 Concurrent Reporting Users and 200 concurrent Viewers:
- CPU: Quad 2GHz+ CPU
- RAM: 8GB+
- Minimum hard drive space: 500GB
Larger cities would need to increase the power in relation to the number of users. This hardware can be standalone, virtualized on larger server systems, or hosted in the cloud. Given the requirements related to maintaining control of personal data, we will consider only the standalone and virtualized systems. Virtualized systems allow scaling of responses to load across the resources of Law Enforcement and Community Organizations. These systems cost more per processing time than the standalone system, but require less maintenance from system administrators.
The server that will host the Web Portal application will also provide the SSL termination facility and will also be a proxy server that will rewrite the requests for the Back-end application server. In the event that the number of requests is large or increases in time, this server can also provide the facility of load-balancing for the Back-end system.
2.4 WEB PORTAL OVERVIEW
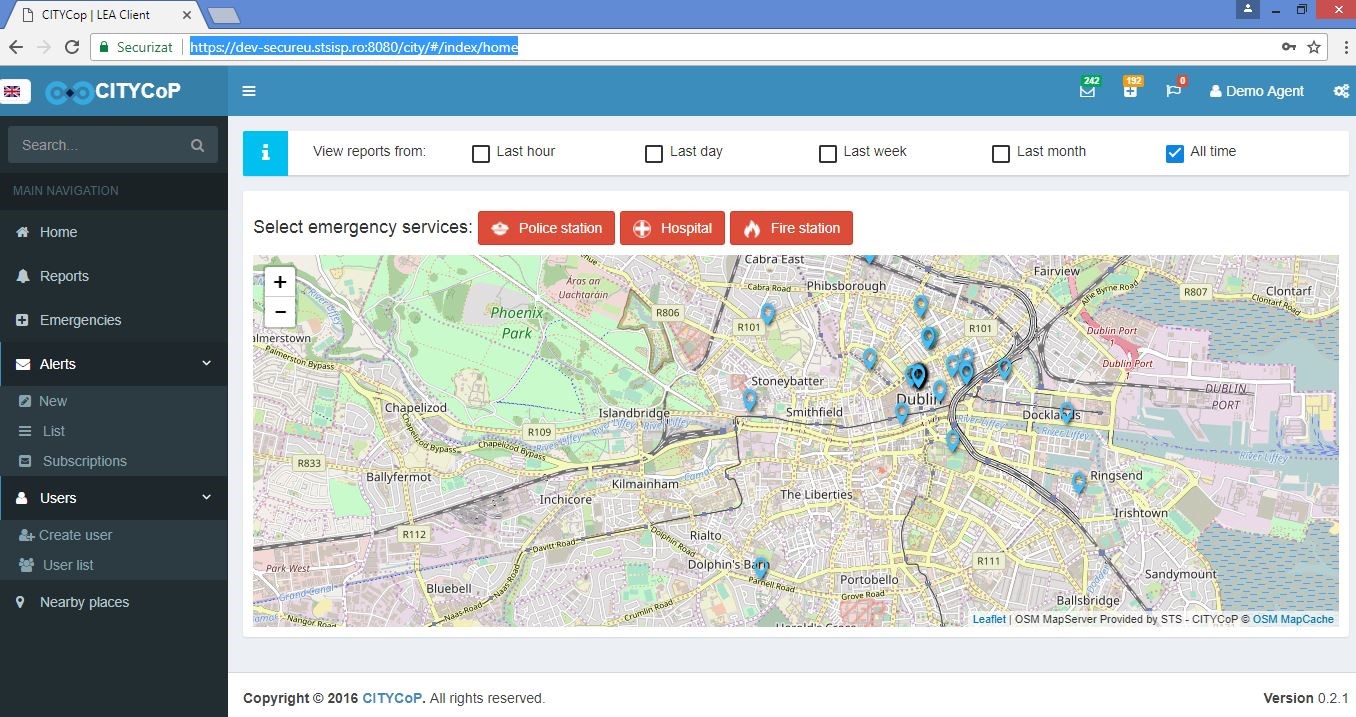
In the screenshot, highlighted using green rectangles from top to bottom, the main web portal overview are presented: the internet address, the name of the user, the option to list reports from different timeframes, the map of the city and the main navigation menu.
2.5 FUNCTIONALITIES
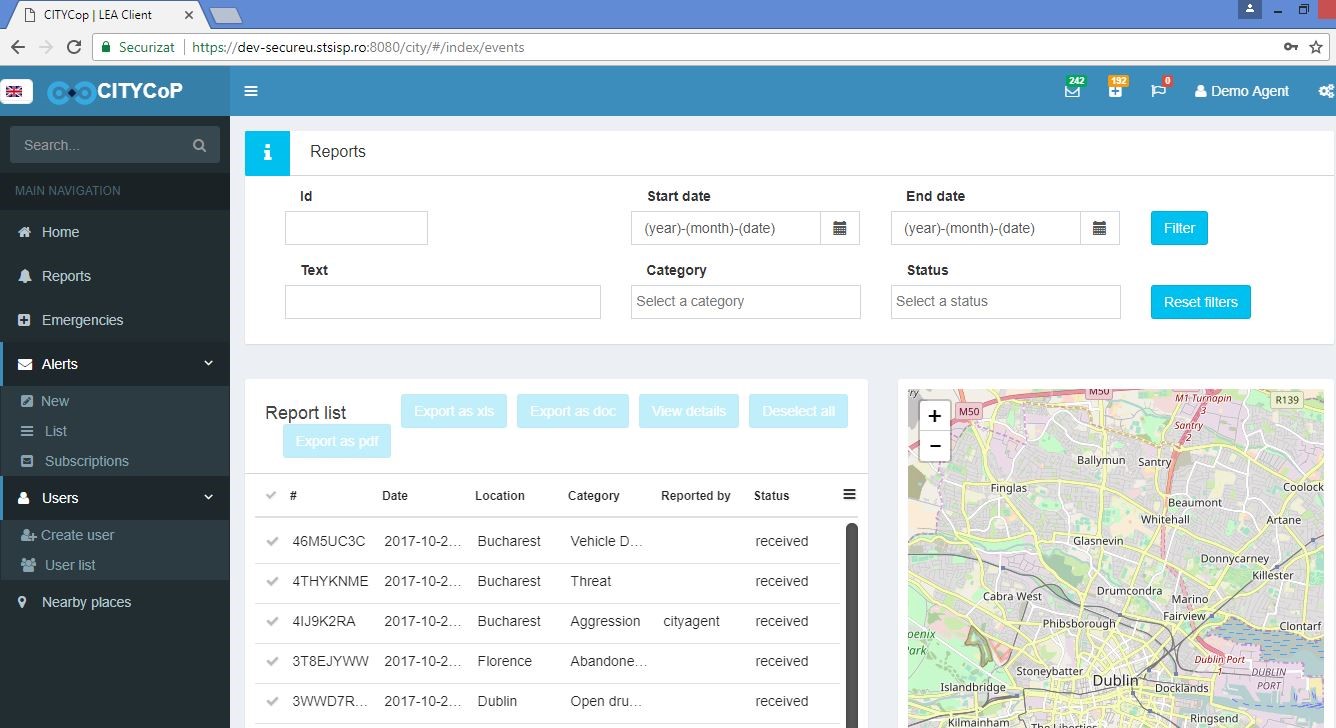
Report function: In the screenshot, highlighted using green rectangles and arrows, from top to bottom, are the main functionalities for managing the reports received, the sorting option using different criteria (start date, end date, category of reports, status) and the report list.
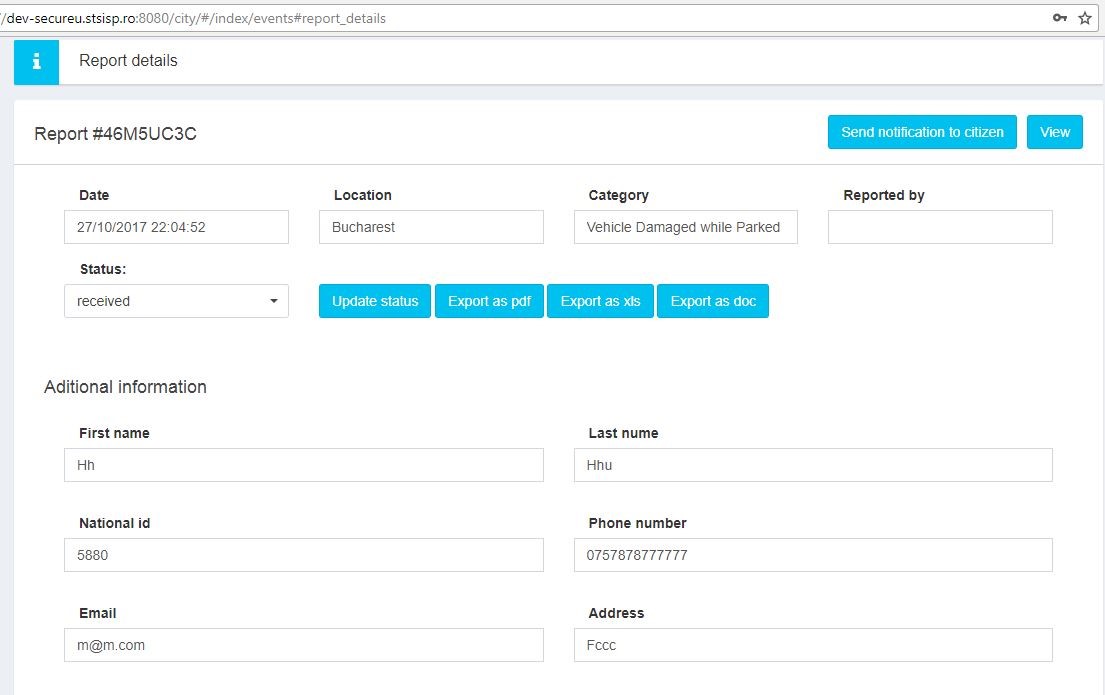
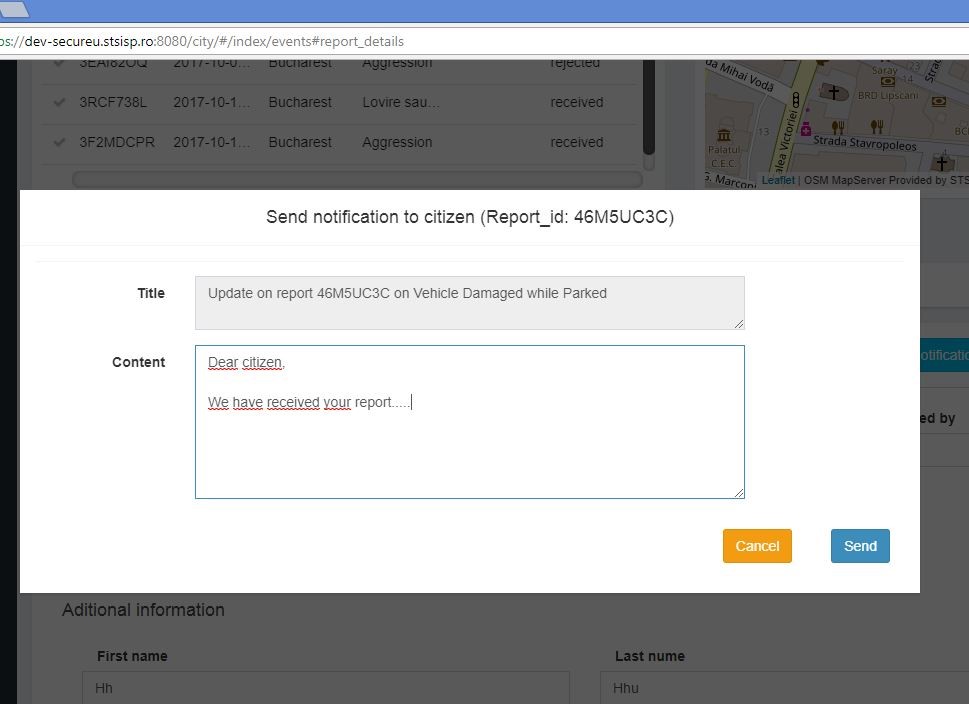
Report details: from the report list, the user can export the data in different file formats (xls, doc, pdf) or can view the report details, as depicted in the screenshot below. The main data provided about the report are: the report unique registration number, the date, location, category and details about whom was sending the specific report. The portal user can update the status of the report and can send a notification to citizen.
Notification to citizen: the user can send a notification to the author of the report, after clicking the Send notification button, indicated with the green arrow in the screenshot above. The text box is open and the user is allowed to write the text of the notification. After completion, the user must click on the Send button.
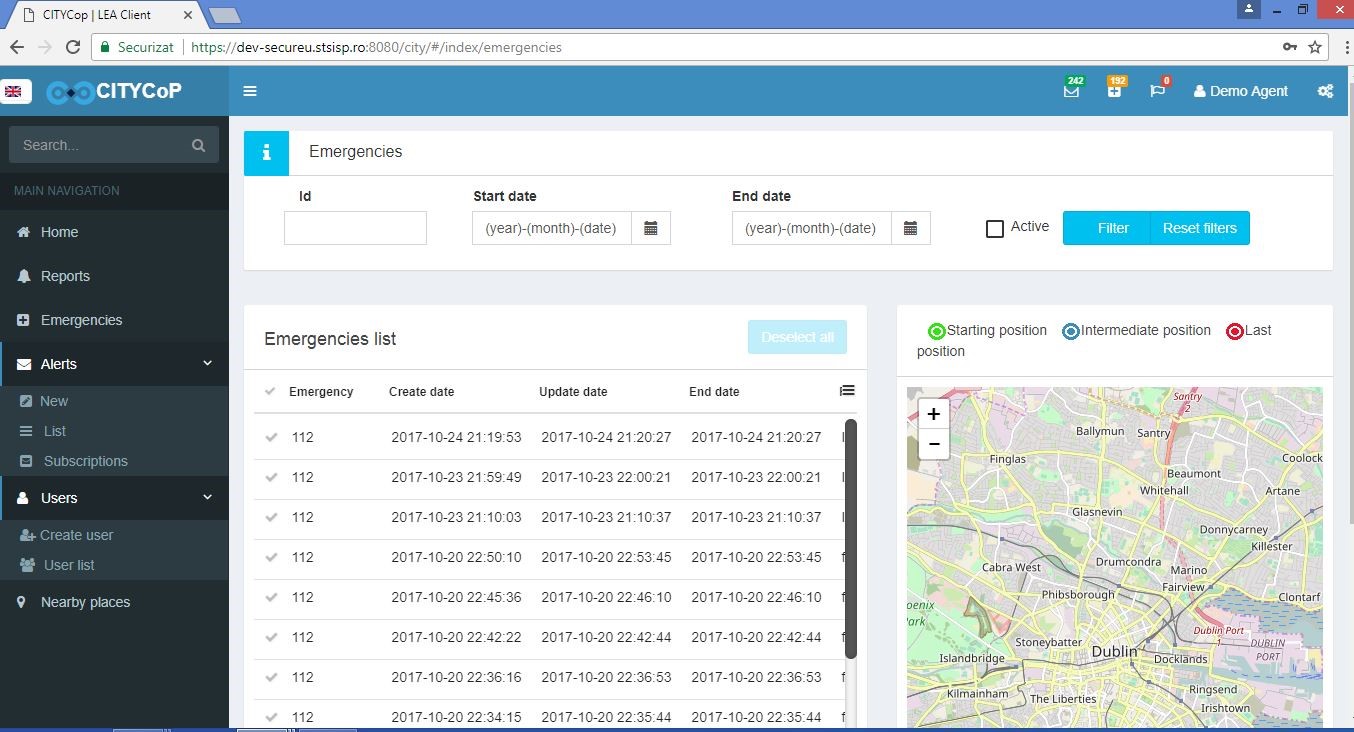
Emergency function: In the screenshot, highlighted using green rectangles from top to bottom, the emergencies list is visualized and also a filter option can be applied, using different criteria of the emergencies reported: id, start date, end date, active emergencies. A different feature of this function is the visualization of the emergencies on the map, using three different criteria: starting position, intermediate position and last position
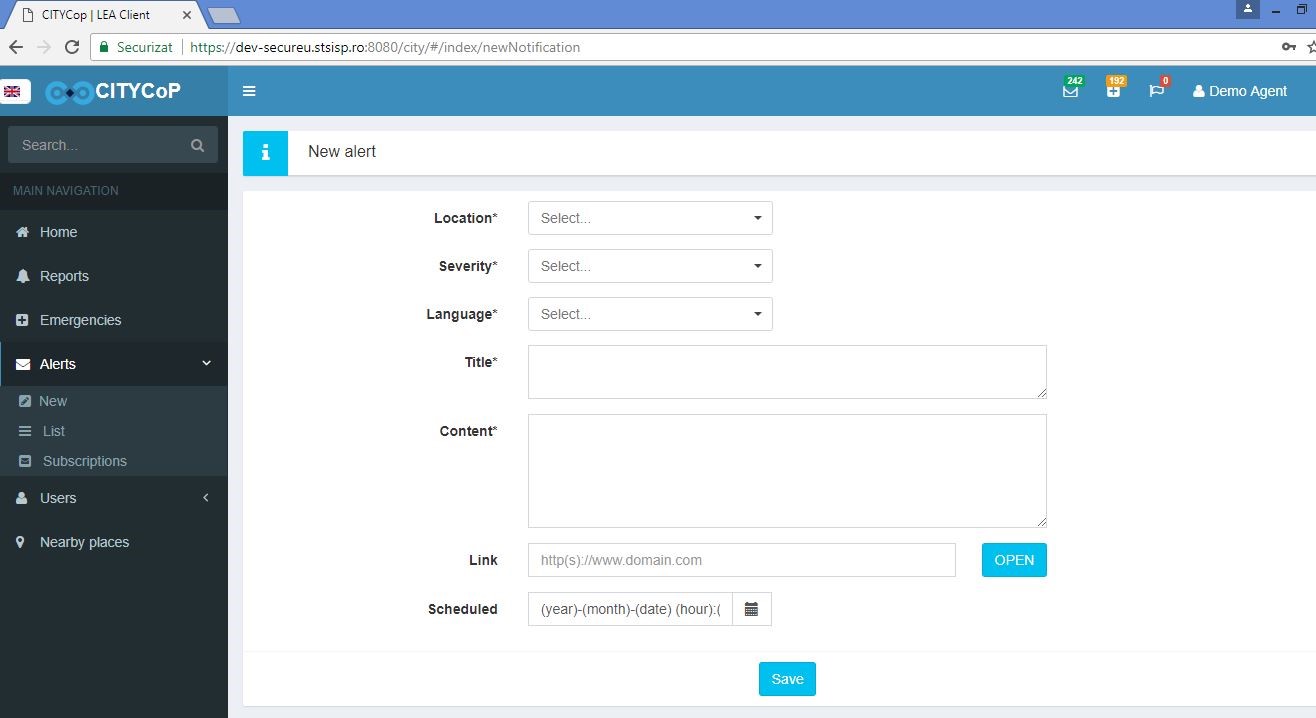
Alert function: In the screenshot, highlighted using green rectangles and arrows the alert function is detailed: after clicking on the left main navigation menu the Alerts button, the New alert feature pops-up and the user can select from different options: location, severity of the alert, language, title, content of the alert, link to an internet domain/ website, timing of the alert (using the calendar function for selecting the year, month, date, hour). After setting all the features of the alert, the user clicks on the Save button.
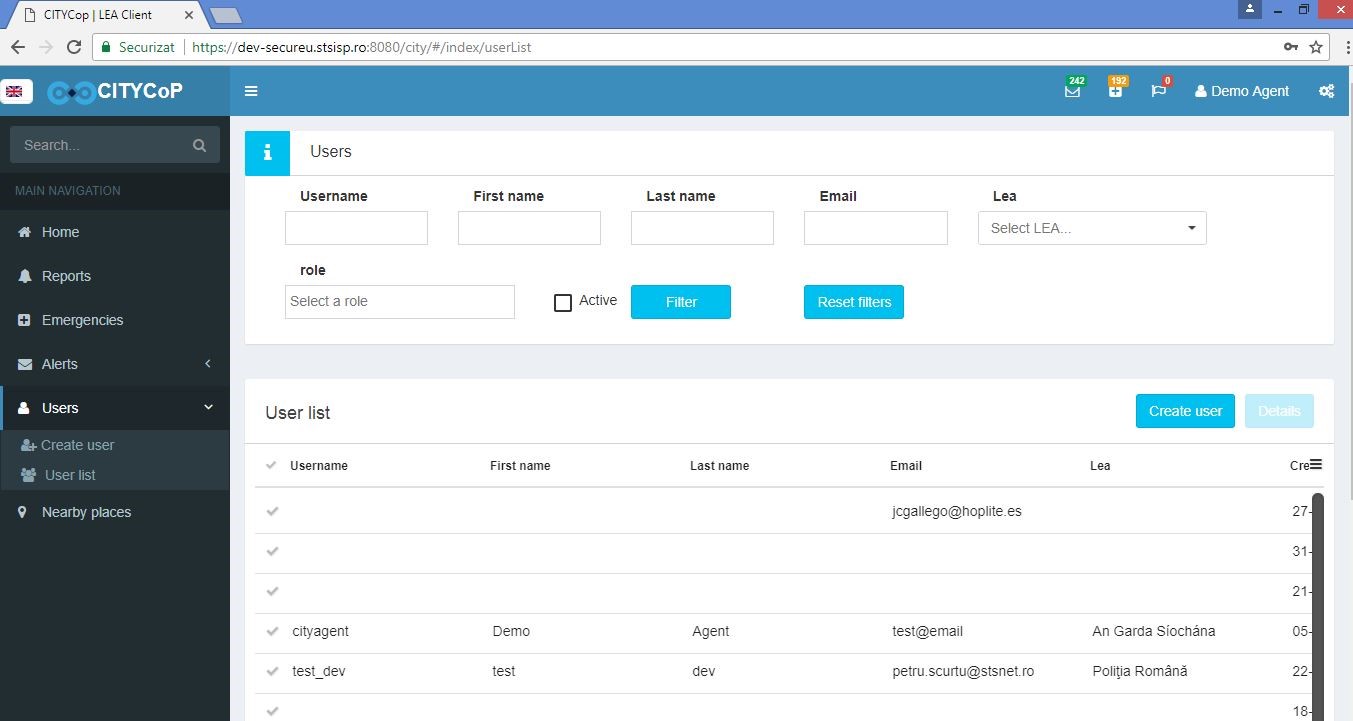
User function: In the screenshot, highlighted using green rectangles and arrows the user function is explained: after clicking on the left main navigation menu the User button, the User page pops-up and the portal user can select from different options: create new user or view the user list and filtering the list after different criteria (roles, active users).
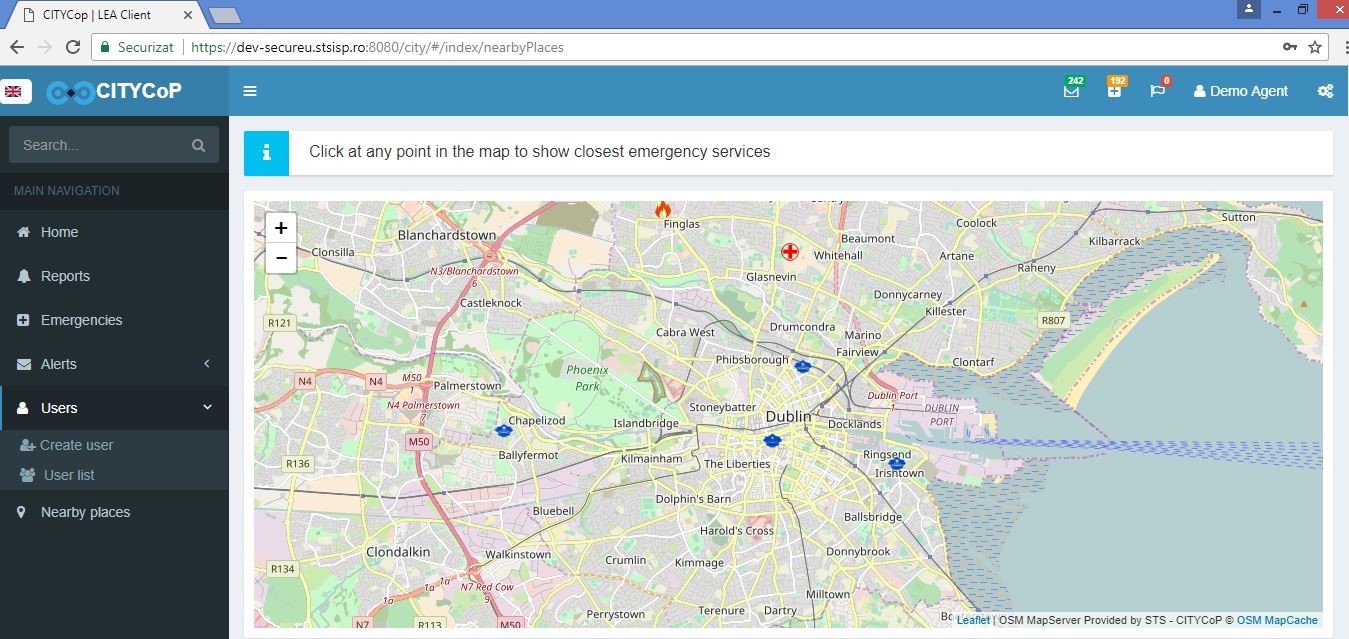
Nearby places function: In the screenshot below, highlighted using green rectangles and arrows the Nearby places function is shown: after clicking on the left main navigation menu the Nearby places button, the city map pops-up and the portal user can click on any point in the map to see the closest emergency services.
1 Technical Requirements for the CITYCoP Mobile App
1.1 General Overview
The main goals of the CITYCoP system are:
- Offer citizens a readily available product to enhance their ability to communicate with the local police and/or local authorities
- Offer the local police and/or local authorities a new tool to receive information, intelligence, and feedback from citizens
The mobile app is currently available for iOS and Android devices.
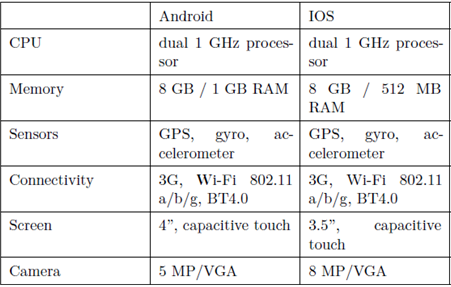
According to the presented studies, the lower CITYCoP mobile app target device is a smartphone with Jelly Bean / IOS 9, that can vary widely in terms of hardware specifications, mostly for the Android devices. From this point of view, the minimal hardware requirements can be defined as:
The specifications for Android OS were synthetized from androidauthority.com, for 2012 top smartphones (e.g. HTC One, Samsung Galaxy S3 and their “mini” versions).
From the same considerations, the minimal hardware requirements for IOS smartphones are represented by the iPhone 4S model.
CITYCoP mobile app will require as much memory space as is decided by the user preferences, for offline access and internal stored events/reports – that refers mostly at the map cache and saved pictures. The maximum size must be established in order to preserve the phone functionality within reasonable limits. The minimal camera requirements are enough for mid-distance photos and autofocus is not needed for most of the expected situations (this is necessary for short distances, like barcode scanning).
The GPS sensor is mandatory for good location tracking, other methods like Wi-Fi location tracking being less accurate and slower. Rotational and inertial sensors can be used to analyse and record activity, correlated with an event.
2 Installation Guide for the CITYCop Mobile App
2.1 General Description of the CITYCoP System
The CITYCoP system is comprised of four components: a portal, a central back-end system, a mobile app, and a social media infrastructure. The following figure (Fig. 2.1) depicts the overall architecture:
In a CITYCoP system we consider two different user roles: citizens and agents, the latter including all kinds of agents, LEAs, fire brigade, etc. The components of the architecture are as follows:
- Z denotes a citizen
- A denotes an agent
- cZ denotes a CITYCoP client for a citizen (either an app or a web portal)
- cA denotes the CITYCoP client for agents (always a web page)
- APIZ denotes the communication API for citizen clients
- APIA denotes the API for CITYCoP agent clients
- APIT an API for connecting social media, e.g. Twitter, (see left hand side of Fig. 2.1)
- APIC an API connecting two CITYCoP systems (see right hand side of the CITYCoP system in Fig. 2.1)
- BE denotes the backend system
1 Serious Gaming in Community Police Training
1.1 General Overview
Serious games are defined as games with a purpose. The purpose can be typically something other than entertainment, such as education, training, politics, advertising, or awareness raising.
One of the key problems when introducing any technology to an organization and the systems surrounding it is acceptance and integration into everyday work practices. To fully realize the benefits of community policing, the CITYCoP project has investigated various ways of how serious games can be used in Police training using the results of that research in the development of two games: Identiface (CEG) and OneCity (ISG/CSG).
Identiface is a game designed to engage citizens in testing their memory of faces. The game evolved over several iterations to a game that focused on teenage engagement, and tried to provide useful feedback about being a better observer.
The second game, OneCity, is a complex simulation of a city and the effect various actions by police have on the fear in the city. The game provides a training environment for the LEA officers to experiment with different aspects of community policing in interactive city situations. This involves the creation of scenarios in urban environments and solving problems that naturally occur in a complex city
To increase the efficiency of using serious gaming in community policing training it is critical that LEA representatives work with the game development specialist to ensure that the scenarios created are playable, engaging, and educational.
We propose that future game development projects working with LEAs for innovation in the use of games requires a collaboration between at least 3 partners in each host country: LEAs, Police Training Organizations/Police Academies, and local Game Development education (academia), see Figure 1.
2 Identiface and OneCity Games
2.1 GENERAL DESCRIPTION OF THE ONECITY GAME
2.1.1 GAME GENRE
The OneCity game is a simulation game with elements of strategy and role-playing. Unlike the typical construction and management simulation genre, this game focuses mostly on management, without the construction element. The city, urban environments, or domestic situations are constructed prior to playing the game (with the use of the Simulation Editor). Note that the construction itself is part of the platform and the police departments can customize the actual game play scenarios to their needs, using the Simulation Editor. The player engaged with a certain scenario is not able to modify the actual setup of the city, but is engaged with the public and will manage the police force available (within the Play-Space).
2.1.2 GAME THEME
The game theme is focused on police work in an urban environment. The game is set in modern times, in contemporary European cities. There are ordinary citizens, petty criminals and more serious organized criminal activities going on in various parts of the city. The cities are themed around one country participating in the CityCOP project, namely, Portugal. Further adjustments for cultural influences are possible and we will establish another collaborating partner country for the game customization. Other thematic customizations are possible to tailor-build the simulations and scenarios for particular national circumstances of EU member countries.
2.1.3 GAME SETTING
The game is set in urban or suburban areas. There are buildings, parks, residential as well as commercial areas, streets, cars, and pedestrians roaming the city. There are police units, walking, or in police vehicles. There are headquarters, and a certain amount of public buildings with activities around them. Some of the scenarios consider football games, domestic situations, and city-hall events.
2.1.4 CORE GAMEPLAY AND MECHANICS
The game consists of a number of scenarios that the player can chose from and engage with. The easier levels require a single scenario or situation, whereas the complex levels engage the player concurrently in multiple areas of the city. The player manages the police force available at their disposal. The player can direct particular police units to certain places in town, and can decide what actions those units will do. The player’s actions directly control the police force, which indirectly influences the public and the evolving situation in the city. Subject to details of the scenarios specified by the LEAs, the player might be able to purchase new police units, upgrade them, or change their characteristics on order to achieve the scenario objectives.
2.1.5 CUSTOMIZATION
OneCity, the interactive city simulation game should be thought of more as a platform for various games rather than a single instance of a game. The main purpose of the platform is to provide easy means of customization and allow various national LEAs to import scenarios that are typical for their own circumstances. The current version employs scenario templates developed with the assistance of the Portuguese Polícia Segurança Pública (PSP).
The OneCity game was released on Google Play on November 2017.
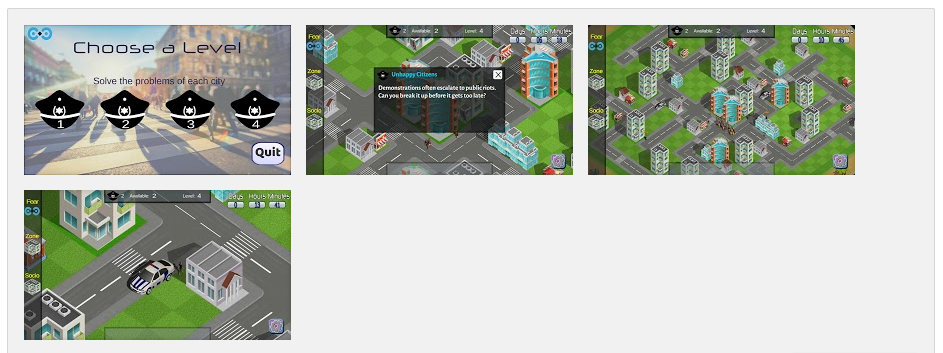
The released version of OneCity contains 4 levels demonstrating various game mechanics used in solving the tasks in the game. The levels are rather simplistic, easy to solve, and keep the game easy to solve. Solving Level 1 unlocks Level 2, and so on. This provides the player with a sense of mystery and progression, as the more complex levels are not visible until the easier levels are solved.
What sets the OneCity game apart is that it acts as a platform for experimentation with various forms of community policing. It is not a single standalone game, but rather a platform with a set of tools that allow Police departments to instantiate multiple situations and scenarios in order to demonstrate principles of community policing. The game scenarios will be primarily designed for law enforcement officers, however, the game can be customized and simplified to be used by the generic public. The game will communicate the principles of community policing and various strategies associated with the concepts of community and community policing.
The game scenarios are tailor-built for cultural and urban environments of a particular nation. Initially, Spain and Portugal are being used as the primary targets. Given the nature of the game, there is no other game that is being developed in close collaboration with the police force around the concepts of democratization of public services and about community policing in particular.
2.2 ONECITY GAME DESIGN
2.2.1 GAMING PLATFORM
The gaming platform for city simulations consists of two core elements. The first is the level editor that allows a designer to set up the level and provide appropriate input to the game as to explore a particular scenario with a given set of circumstances as well as actions that can be taken. The editor will allow the designer to set up the city with the police units, and specify what sort of scenario should be played, how various actions and reactions happen, how they are scored, and when the level is considered completed. The gaming platform will have pre-populated modules that will ease the level development.
2.2.2 TARGETED PLATFORMS
The Simulation Game for training purposes targets PC hardware, such as Windows, MacOSX and Linux. The game is built and tested on Windows and MacOSX.
The playable version of the game for Citizen Engagement targets mobile platforms (smartphones and tablets), specifically Android and iOS. However, the game can be run as a stand-alone executable on a standard PC as well. The city and Scenario Builders were designed to be used on the PC, not on the mobile platforms.
Simulation Design Elements
2.2.3 FEAR
Fear is an important concept for game mechanics and modelling the city. Each tile in the city has a fear value related to it, indicating how scary the tile is interpreted by the citizens. This fear mechanic will be visible through a mini-map during the gameplay, and the player will be able to toggle a filter to view the city coloured by fear. Some buildings might also be visibly changed or even blocked by having a too-high fear value attached. Some events are supposed to be triggered based on fear in the city. For instance, tagging is performed in areas with high fear, marking them more permanently as scary parts of the city.
All citizens also have a fear value related to them. The citizens are responsible for spreading the fear throughout the city. Citizens are also responsible for reporting areas in the city with high fear values to the police. These events will incentivize the player to use resources to patrol the reported part of the city, to reduce the distress of the population. Ignoring these reports will lead to the citizens losing confidence in the police, decreasing the trust in the police’s ability to perform proper police work, and reduce their likelihood to report issues again.
2.2.4 ZONES
The game includes a zone-mechanic, enabling the city to be divided into different zones that can be referred to. These zones are defined by pins placed by the city builder, and events can affect all buildings or citizens in a particular zone. The zones can also be connected to how the population reacts to police interaction. Some zones might be positively impacted by police patrols, so the citizens feel more secure, while in other zones the police patrols increase the fear of the citizens.
2.2.5 DAY-NIGHT CYCLE
For the scenarios to feel more dynamic and realistic, the game includes an in-game simulation of time. A clock will tick while the simulation is running, determining what time of the day it is. Buildings and streets would have different sprites for day and for night. The visual day night-cycle has not been implemented fully, however, the clock is part of the simulations and it impacts the citizens lifecycle.
2.2.6 EVENTS
As initially planned, there will be events occurring in the game. Due to the introduction of fear, some events are planned to be related to the state of the city. Events such as graffiti are prompted by high fear values and a random chance of occurring. Other events such as demonstrations can be started by a building having a high fear value, in addition to the citizens related to this building also being fearful. These emergent events are not directly planned in the scenario, however parameters for their occurrence will be set in the scenario builder.
2.2.7 REPLAY FUNCTIONALITY
The replay functionality is a useful tool for educational purposes, enabling police trainers to inspect a play-through to discuss the choices of the player. This would require the game to be idempotent, meaning that the game would run the same each time. Due to reliance on delta time, we cannot say the game is idempotent, however we can make it close by seeding the random values we create. All actions and choices made in the game will be saved to file with a timestamp and other necessary data, which will make it possible to recreate the different choices made during the play-through in a replay session.
2.2.8 MODULAR DESIGN
The project is split into three modules:
This split of the level editor aims to facilitate different tasks and features for those two aspects of the scenario building. The playable game is not affected by this split. The city builder is used for creating cities the game will be played in. These cities include streets and buildings, as well as labelling buildings so they can be referred to in the scenario builder. The scenario builder is used for setting up a citizen model and events, in addition to other parameters that can be included into the scenarios.
2.3 GENERAL DESCRIPTION OF IDENTIFACE (THE FACE MATCHING GAME)
The main objective of the CEG, namely The Face Matching Game, or Identiface, is to give citizens a positive experience of engaging with the Police or Municipality. The specific use of this type of game can be based on any set of image recognition tasks. Facial recognition is merely the first option tested. The individual LEA should decide what citizen memory challenge exists. The task is then to generate the collection of images and tag them as “to remember” and “distractor” to help train citizens on those skills. Learning the skill is a secondary objective for this app, as the primary use is creating a positive engagement with the LEA.
The CEG can be used as part of the media outreach campaign when introducing the CITYCoP system (SecureU). The game has areas for linking to the SecureU app, and can encourage downloading of the SecureU app.
2.4 IDENTIFACE GAME DESIGN
At the beginning of the Identiface game, the player sees an avatar/cartoon face and is given time to memorise its characteristics (nose, hair, ears, eyes, etc.). Then, an array of faces is shown and the player tries to pick the right face, always taking into consideration potential changes in the face’s appearance (e.g. change of hair colour, different haircut, glasses, etc.). The player scores according to how fast he/she picked the correct face. In this early version of the game, every wrong answer concluded the game without points. The game progressed in difficulty, so the duration of the play also indicated the ability of the player. The Identiface prototype had 10 levels and an estimated playtime of approximately 5 minutes. The many levels and the progressive difficulty allowed for different level designs and for the testing of various design questions, about the length of the array of faces (4 or 6 faces), the time needed for the player to pick the right face (10-15 seconds or no time limit), and the preferred interaction method for going through the array of faces (swiping or scrolling).
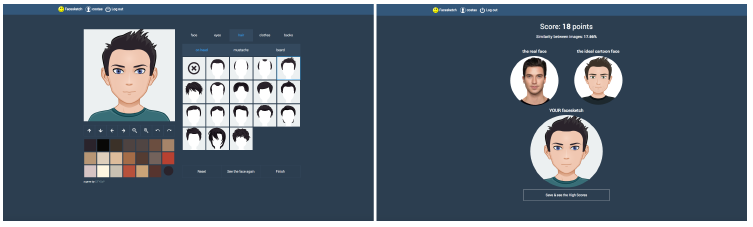
Figure 2: Using the avatar-creation tool (left) and getting the results (right) from the Facesketch game
(link).
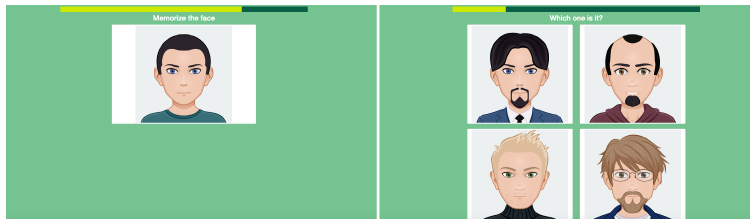
Figure 3: Memorising the face (left) and attempting to recognise it through an array of different faces (right), in the Identiface game
(link).
2.4.1 MAIN TECHNICAL REQUIREMENTS:
The main technical requirements are the following:
- The game runs as a mobile and web application, using Node.js.
- The game is available in several languages.
- The game provides a link to the CITYCoP app (SecureU).
- The game requires low-speed internet connectivity.
- The game uses open-source tools wherever possible.
2.4.2 GAME INTERACTION
The game play process is as follows:
- A cartoon/avatar face is presented to the player.
- The player memorises the face’s characteristics (nose, hair, ears, eyes, etc.).
- An array of 4 cartoon/avatar faces is presented to the player.
- The players compares any common facial characteristics between the memorised face and the 4 line-up faces, calculating also any possible changes in hairstyle, facial hair, glasses, and mouth expression.
- The player picks a face.
- The player collects points according to the elapsed time that it took him/her to identify the face.
2.4.3 GAMEPLAY FEATURES
The game is a platform for testing visual recognition. The features that have been implemented at this stage include:
- 4 difficulty levels (Easy, Normal, Hard, Very Hard) and scalable difficulty
- 7 game levels: 1 x Easy, 2 x Normal, 2 x Hard, 2 x Very Hard
- 5-15 seconds for the player to memorise the face, depending on the game level’s difficulty
- Points scoring and recording to a high score system
- Time is a factor in scoring (the faster, the more points)
- Scenarios for LEAs to adapt the game to either continue to the end of the level or exit on a wrong answer
- Leaderboard: Adding the Top Scores to a leaderboard
- Facebook Sharing has been tested but is waiting integration
2.4.4 DEFINING GAMES LEVEL DIFFICULTY
The difficulty of the game levels is defined by: a) the time that the player has to memorise the face and pick the right one, and b) the number of different facial characteristics of the distractors, the other faces of the line-up. The facial characteristics that can differ are:
- Face shape
- Nose
- Ears
- Mouth
- Eye shape
- Eyebrows
- Hairline
- Hair colour
- Skin colour
2.4.5 CHANGES IN APPEARANCE
The correctly matched face can differ by utilising the following characteristics:
- Glasses
- Facial hair (moustache - beard)
- Hairstyle
- Mouth expression
2.4.6 DIFFICULTY LEVEL DEFINITION
- Easy level: 3-4 different facial characteristics for the other faces + 2 basics (Hair colour and Skin colour), 15 seconds
- Normal level: 3-4 different facial characteristics for the other faces, 15 seconds
- Hard level: 2-3 different facial characteristics for the other faces, 10 seconds
- Very Hard level: 2-3 different facial characteristics for the other faces, 7 seconds